Statistics Vibe
The statistics Vibe probably has access to the widest range of information out of all of the Vibes. Within babblevoice, data is collected whenever a call hits a collection point. Depending on what happens in the process of handling the call, i.e. the call enters a queue or rings a phone, then different data is captured.
Each report can show data in periods of an hour or day, then a graph can show a number of those periods, for example, a week's worth. You can then look at an offset, for example - by the hour for 24 hours this time last week allowing charts to be presented for cyclic periods.
Reports can be visualised differently
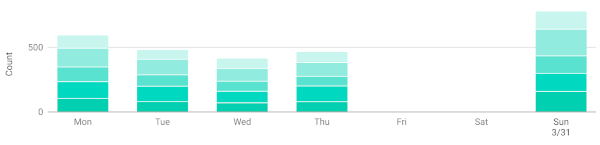
- Bar chart
- Time chart
- Scatter chart
- Pie chart
- Number
The last 2, Pie and Number, differ from the rest (as well as different in their display) in what data they can display. With a bar chart, these charting types are capable of displaying time series data. With Pie or Number, it will only show the most recent time in the result.
The statistics Vibe can show data relating to the following categories:
- Devices (aka phones)
- Users (similar to phone data - but assigned to a user using that device)
- Numbers (the real world phone numbers)
- Queues
- Auto Attendants
- Call Cost
- Call List Tags
Collection and the reporting of that data are broken down into 3 different sections:
Anonymised Data
This data is completely anonymised (excluding data which is phone/user centric for example, user 'Nick Knight' statistics indicates a person).
Then for each section, there are multiple reports available.
Data Retention
For all statistics we maintain 1000 data points. What does this mean?
If you are collecting the average wait time that a caller spends in a queue. Then we have to store the wait time for each call which waited in that queue. If you are interested in the wait time averaged over an hour, then this data is only meaningful if the number of callers is less than 1000 in that hour.
Once it has calculated the average this is then stored in another table. Again, we make space for 1000 data points for this transformed data. If we are looking at average per hour, then 1000 slots of 1 hour each, this means we have roughly 41 days of history.
The 41 days is the minimum you can rely on. If there are times where no phone calls happen, then that particular slot is not used in the table so another time gets to use that slot. For a business which only has office opening times then only data between Monday-Friday 09:00-5:30 will collect data, this greatly expands the history you will see in your Vibes report.
Data Details
A list of all the data which can be reported on can be found here.